The RBA holds rates at 3.6% and warns of rate hikes next year
By Dr Shane Oliver – Head of Investment Strategy and Economics and Chief Economist, AMP Capital | 10 Dec 2025
Key points
- The RBA left its cash rate on hold at 3.6% as widely expected at is December meeting.
- Its commentary also became more hawkish (ie leaning towards a rate hike) on the back of the further rise in inflation in October. Governor Bullock reiterated that the Board will be data dependent and effectively warned it may have to raise rates if inflation does not fall back.
- We now expect the RBA to leave rates on hold next year with a fall back in inflation and still fragile consumer spending avoiding a rate hike but concerns about capacity constraints as the economy recovers likely preventing a rate cut and keeping the risk of a rate hike high.
RBA holds at 3.6% with a far more hawkish tone
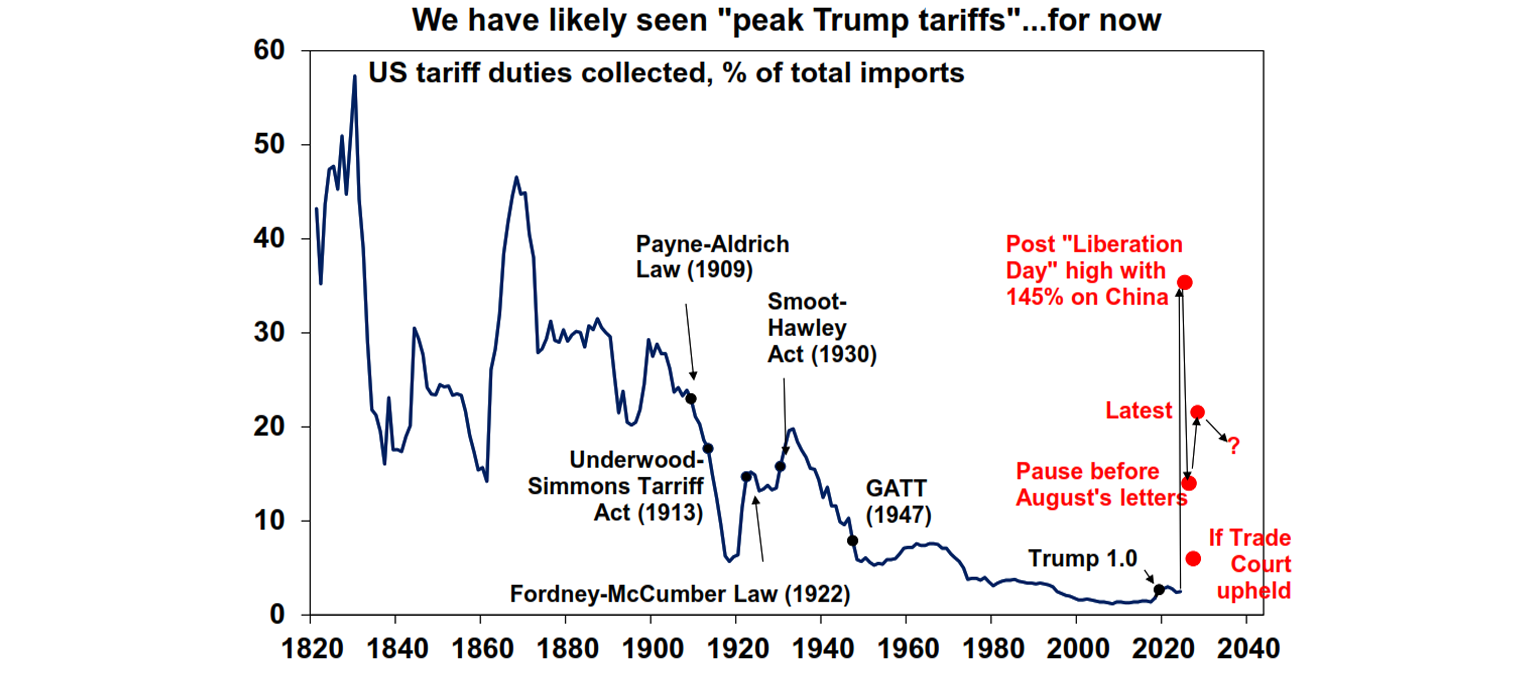
2025 initially saw turmoil as US President Trump announced tariffs that were much higher than expected along with a bunch of other moves to upend US institutions and the global economic order. But the global economy held up okay. Key big picture themes for investors were:
The RBA’s decision to leave rates on hold at 3.6% was no surprise with it being the consensus amongst all 29 economists surveyed by Bloomberg and the money market factoring in zero chance of a change. The decision leaves the RBA having only reversed three of the 13 rate hikes seen in 2022 and 2023 (not that a cut back to a 0.1% cash rate was expected) and mortgage rates around levels prevailing 13 years ago.
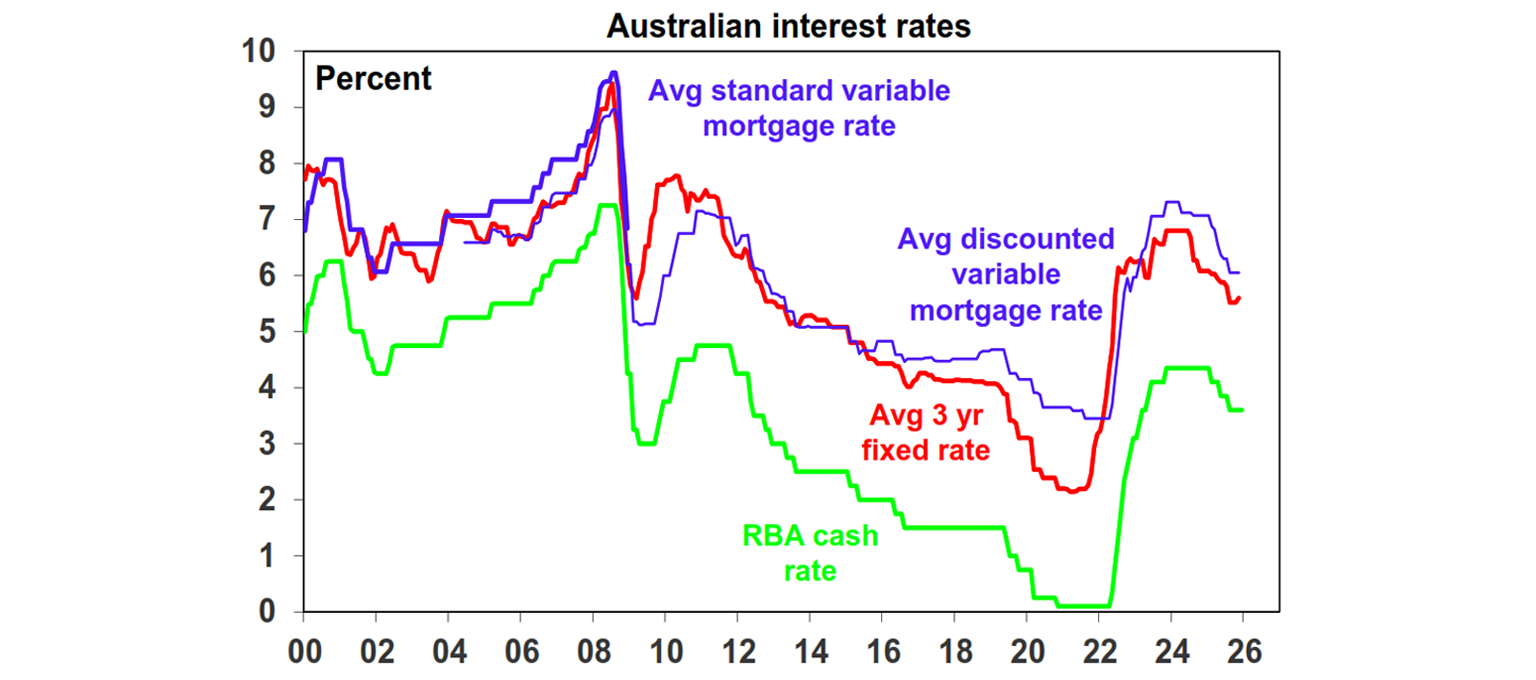
Source: Bloomberg, AMP
The RBAs on hold decision follows the further increase in inflation seen in the new October monthly CPI which occurred in both headline and trimmed mean (or underlying) inflation and has taken Australian inflation back above many comparable countries. See the next chart.
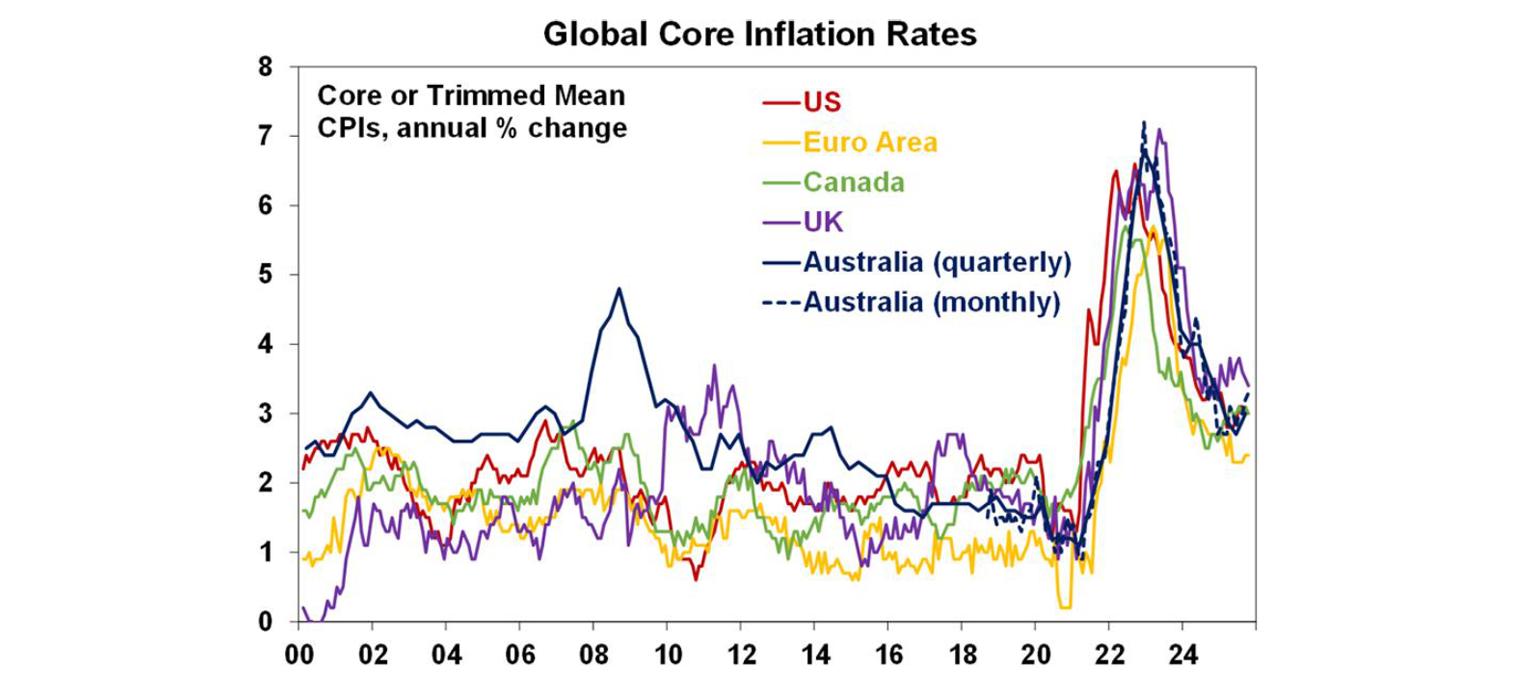
Source: Bloomberg, AMP
Given the recent run of hotter inflation and demand data it was also not surprising to see the RBA further ramp up its hawkish commentary, but it’s now explicit after Governor Bullock’s press conference that the RBA now has a tightening bias. To be sure, the RBA expressed caution about reading too much into the new monthly CPI showing a further rise in inflation and reiterated that it expects some of the rise in underlying inflation to be temporary.
But its commentary was progressively more hawkish compared to last month with the post meeting Statement noting that the rise in inflation may be becoming more broad based, growth is picking up including for private demand, the housing market is continuing to pick up, the labour market remains a little tight, surveys show capacity utilisation above its long-run average, growth in unit labour costs remains high and if the pickup in the private sector continues it will add to capacity pressures. All up the RBA concludes that “the risks to inflation have tilted to the upside”, whereas the language previously noted “uncertainty…in both directions”. And at the same time the RBA notes that the impact from global uncertainties has been minimal.
Governor Bullock’s press conference comments came across as even more hawkish than the post meeting Statement. In particular she noted that the RBA did not consider a cut but did consider circumstances that may drive a hike, it did not see cuts in the “foreseeable future” so its about a hold or hikes and she reiterated a recent warning that “if inflation pressures look to be more persistent then it..might have to consider whether we need to raise rates.” And further that “if it looks like inflation is not coming back to the band then the Board will have to take action and it will.”
This effectively leaves the door wide open for higher interest rates next year if needed.
The RBA also indicated it will remain data dependent and, on this front, December quarter CPI data to be released in late January ahead of the RBA’s next meeting in February will be key as to whether we see a rate hike early next year.
We expect the RBA to leave rates on hold in 2026, but the risks are now a bit more on the upside
We are now forecasting rates on hold through next year, amidst conflicting economic indicators.
- On the one hand, the rising trend in unemployment, falling job openings, the tendency for economic data to run hot and cold, uncertainty around the new monthly CPI and business surveys suggesting its pick up could be partly temporary (with final product price rises in the NAB survey remaining benign – see the next chart) and the fragile consumer recovery (with, eg, the NAB business survey reporting easing consumer sector orders) suggest that it’s too early to be considering rate hikes. And it’s arguable that potential economic growth at present is really now above 2%yoy given productivity growth of 0.8%yoy and labour force growth of 1.9%yoy, rather than at 2%yoy which is around the economy’s current growth rate.
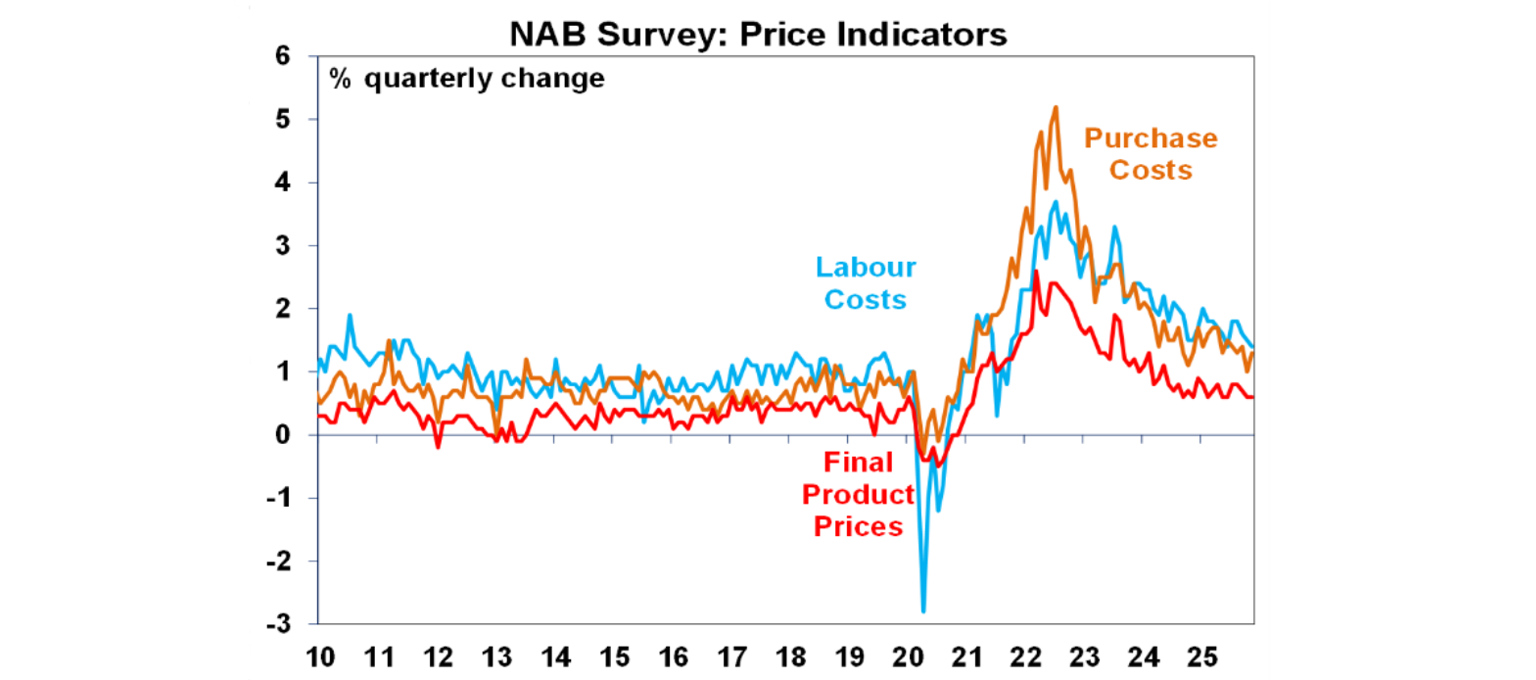
Source: Bloomberg, AMP
- But on the other hand, the strengthening trend in domestic demand growth and consumer spending, rising capacity utilisation in the NAB survey along with the renewed rise in inflation runs the risk that the economy is bumping into capacity constraints and possibly suggests that monetary policy is no longer restrictive. This would suggest that the risks are skewed to a rate hike next year.
So, on balance we expect to see the cash rate remain at 3.6% in 2026, with the swing back to rate hikes more a story for 2027. But we concede that the risks look like they are now a bit more to the upside on rates in 2026. However, our assessment is that the swing in the money market from expecting 2 or 3 more cuts after the August RBA meeting to now expecting nearly two hikes next year is premature and a bit too extreme.
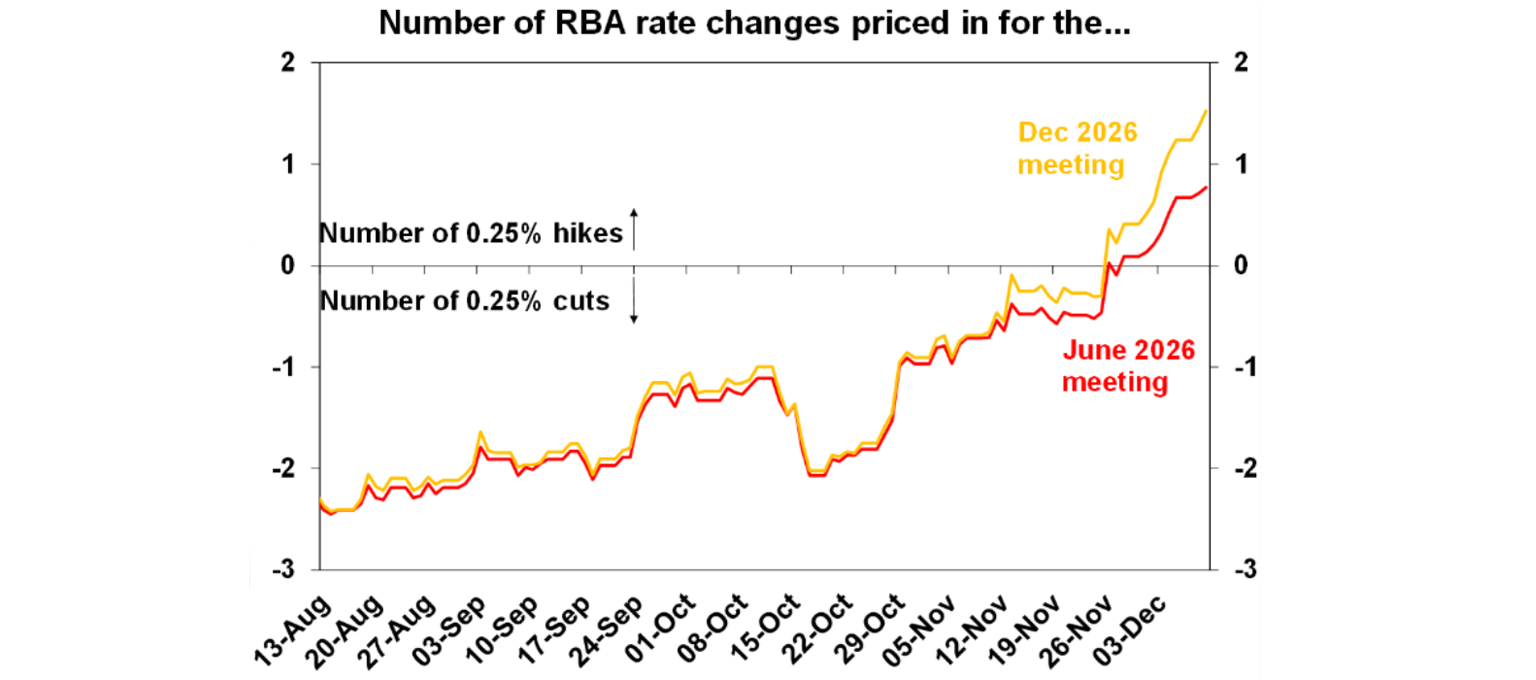
Source: Bloomberg, AMP
That said as noted above the key to what happens early next year will be the December quarter CPI to be released in late January, with the November CPI on 7th January providing some early indication. Our assessment is that underlying inflation will drop back a notch to 0.8%qoq or slightly less from 1%qoq in the September quarter – partly supported by the weaker trend in final product prices from business surveys – allowing the RBA to remain on hold at its February meeting. Of course, if trimmed mean inflation in the December quarter does not fall back as we expect (and comes in around 0.9%qoq or more) than a hike as early as February is possible. Note that the RBA’s implied forecast in its November Statement on Monetary Policy is 0.8%qoq.
The bottom line
While the RBA is rightly more hawkish in order to send a signal that it’s committed to getting inflation back to target and therefore to help keep inflation expectations “well anchored”, our base case is that rates will be left on hold next year at 3.6% as inflation falls back, albeit the risks are now skewing a bit to the upside. December quarter CPI inflation is the key to what happens early next year on rates.
It’s also worth noting that while rates bottoming at 3.6% is not good news for those with a mortgage it may not be such a bad thing to the extent that it reflects a more positive economic outlook as this will underpin a return to profit growth in Australia after three years of falling profits. Of course, it won’t be so good if inflation stays above 3%yoy.
And for those wondering – Governor Bullock noted that the RBA will look through the impact of the ending of the electricity rebates on inflation next year, just as they looked through their impact when they were applied.