Housing affordability at a record low – here’s four key ways to fix it
By Dr Shane Oliver – Head of Investment Strategy and Economics and Chief Economist, AMP Capital | 25 Nov 2025
Key points
- With the latest surge in home prices relative to incomes housing affordability is at a new record low. This is adding to a slide in home ownership and rising inequality.
- The key to sustainably improving housing affordability is to better align immigration to housing supply, boost housing supply, encourage decentralisation and some tax reform.
- There are no quick fixes, and we have a long way to go.
Introduction
For as long as I have been an economist, housing affordability has been an issue. But while it was once mainly a cyclical concern associated with bouts of high interest rates, from the 2000s it’s become a chronic problem. With national home prices at new record highs housing affordability has reached a new record low. This is a terrible situation for a country with so much land and a small population that used to pride itself on the “Aussie dream”. This note looks at what can be done to fix the problem and why at the same time we need to make sure – in the face of calls to slash immigration and densify our cities – we don’t throw the baby out with the bathwater and create bigger problems.
Housing affordability keeps getting worse
But first a quick recap – how did we get here? After strong gains in home prices over many years, Australian housing is expensive relative to income, rents & its long-term trend and by global standards. Poor affordability is apparent in a surge in the ratio of average dwelling prices to average wages(red line in the next chart) & household income (green line) – both of which have more than doubled since 2000 and with the recent rebound in prices are now at record highs.
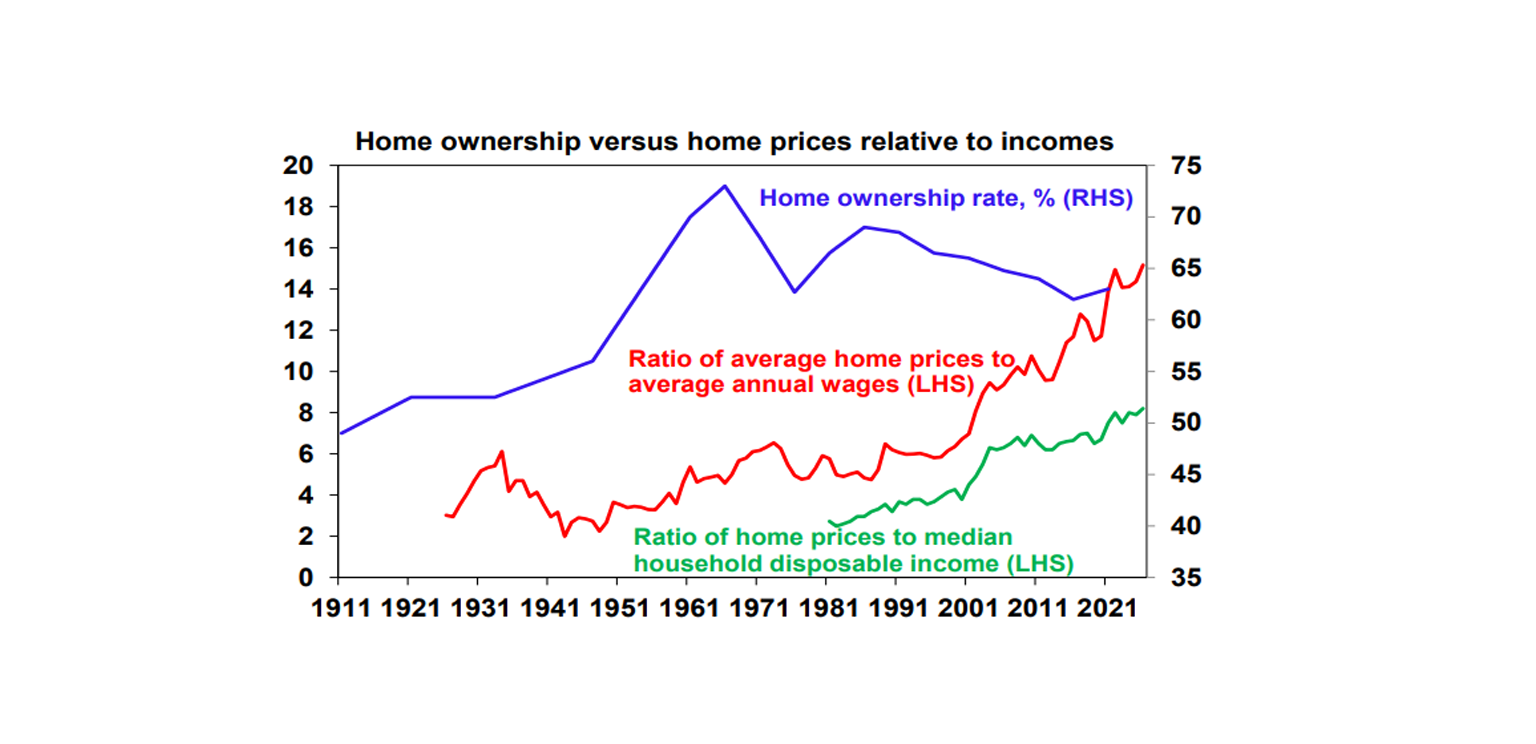
Note home ownership data is only available from 5 yearly census. Source ABS, Cotality, AMP
The time taken to save a deposit has also doubled over the last 30 years and is now at a record 11 years. Sure, a first home buyer can now get in with a 5% deposit, but this is with 95% debt! And the deterioration in affordability has contributed to a falling trend in home ownership, along with a range of other factors(see the blue line in the previous chart).
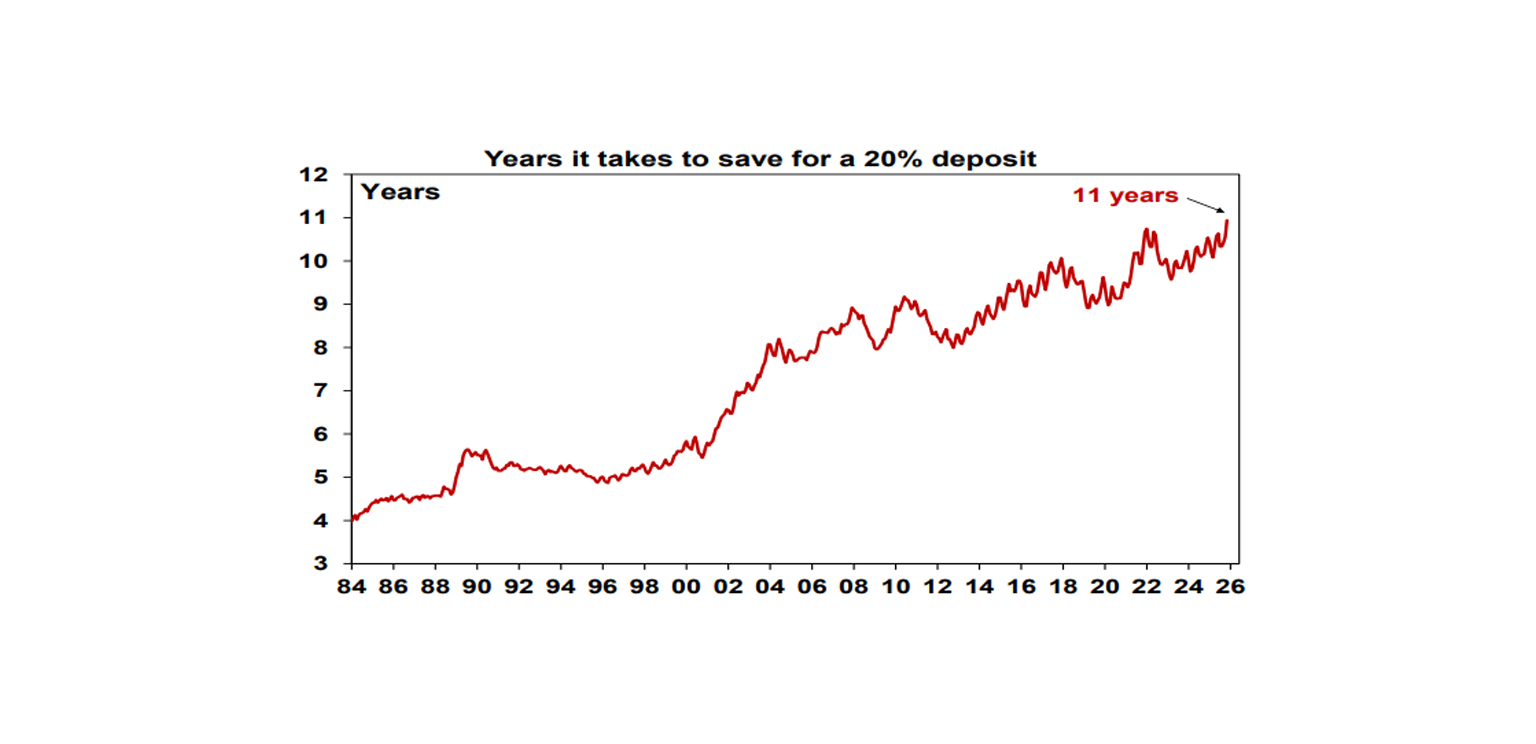
Source: ABS, Cotality, AMP
Key drivers of poor housing affordability
The drivers of poor housing affordability are hotly debated. Many zoom in on things like tax concessions for investors, SMSF buying and foreign demand. But investor and foreign demand were not big drivers of the 20- 30% surge in prices over 2020-22. And property tax concessions are common in other countries, without such poor affordability. Rather the key drivers have been a combination of three things:
- The downtrend from high interest rates at the start of the 1990s to low rates before and in the pandemic along with the increased availability of debt boosted borrowing ability and hence buyers’ capacity to pay for homes. But this is not the full story as lots of comparable countries have had low interest rates without such expensive housing. And interest rates are well up from their pandemic lows and yet affordability is even worse.
- Housing supply (for reasons ranging from too much red tape to capacity constraints) has failed to keep up with a surge in demand for housing that started in the mid-2000s with rapid population growth.
- The concentration of people in just a few coastal cities hasn’t helped.
Of these, the fundamental demand/supply mismatch is the critical factor behind poor affordability. This can be demonstrated in the next chart.
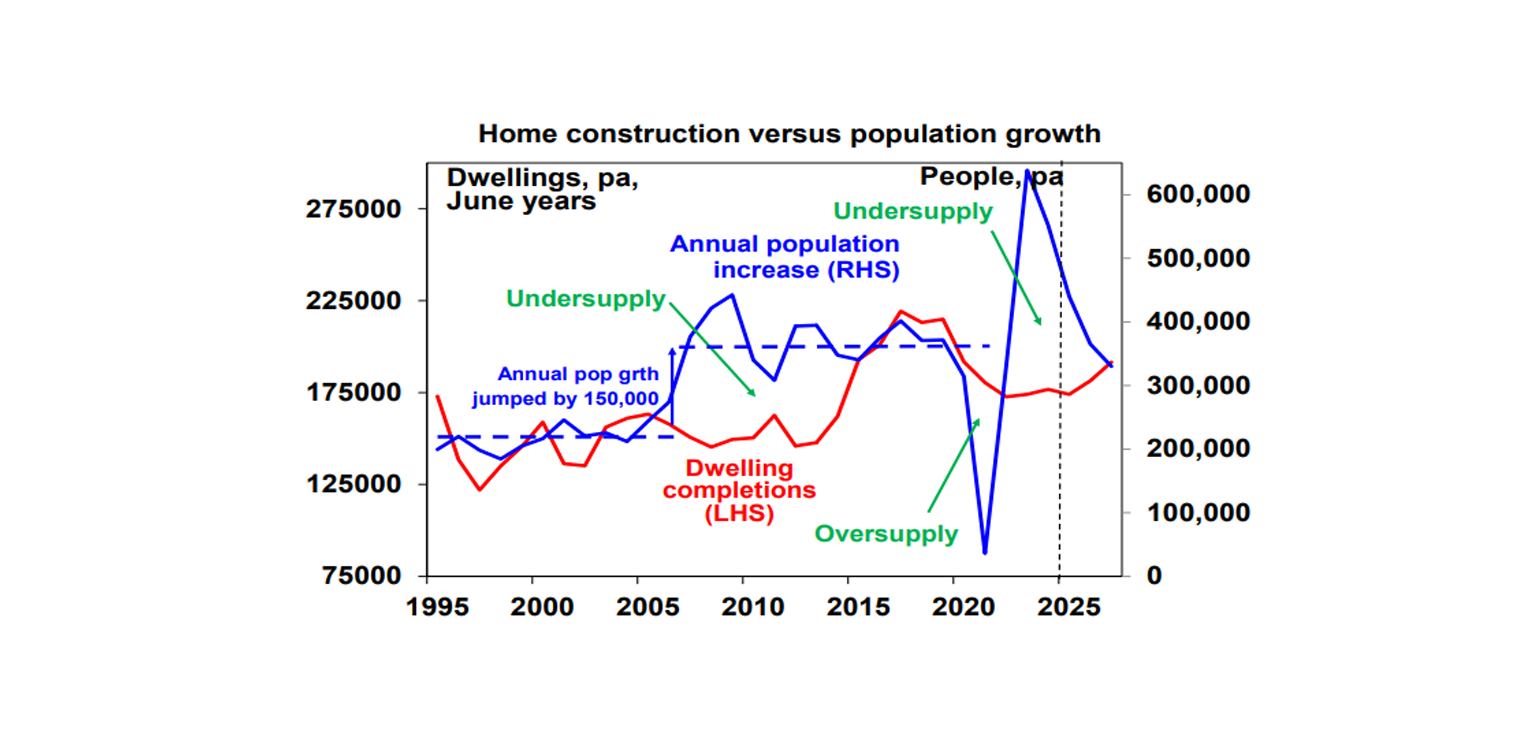
Source: ABS, AMP
Starting in the mid-2000s annual population growth jumped by around 150,000 people largely due to a surge in net immigration – see the blue line in the prior chart. This should have been matched by an increase in dwelling completions of around 60,000 homes per annum but there was no such rise until the unit building boom of 2015-20 leading to a chronic undersupply of homes – see the red line. The unit building boom and the slump in population growth through the pandemic helped relieve the imbalance but the unit building boom was brief and a decline in household size from 2021 resulted in demand for an extra 120,000 dwellings on the RBA’s estimates. The rebound in population growth post the pandemic then took property market back into undersupply again.
The next chart translates this into an estimate of the cumulative undersupply of dwellings in Australia. Up until 2005 the housing market was in rough balance. It then went into a massive shortfall of about 250,000 dwellings by 2014 as underlying demand surged with booming immigration. This shortfall was then cut into by the 2015-20 unit building boom and the pandemic induced hit to immigration. But it’s since rebounded again to around 220,000 dwellings, or possibly as high as 300,000 if the pandemic induced fall in household size is allowed for. The shortfall is confirmed by low rental vacancy rates.
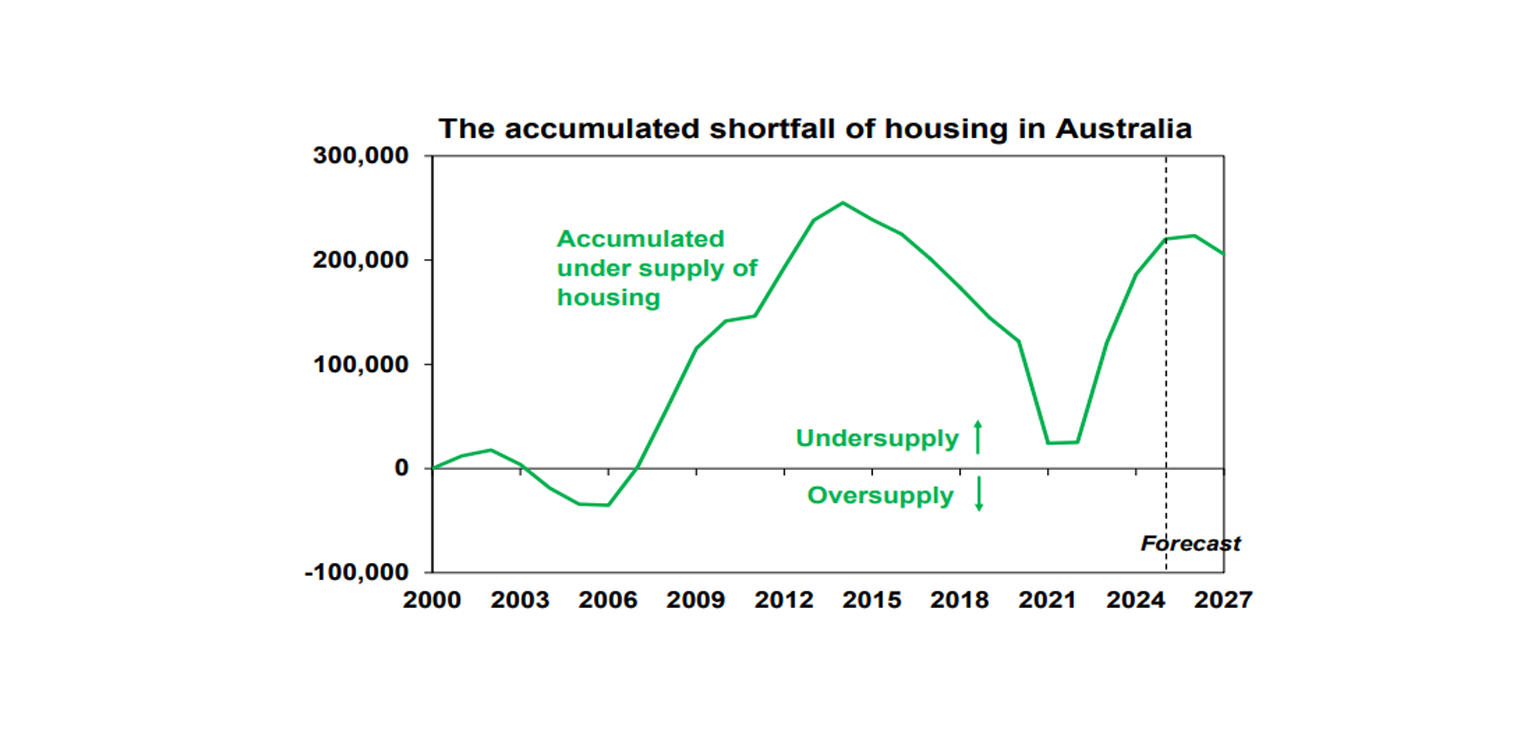
Source: ABS, AMP
Four key things to improve housing affordability
Very high house prices and associated debt levels relative to wages pose two key problems. First, they pose the risk of financial instability should something make it harder to service loans. Second, the deterioration in affordability is resulting in rising wealth inequality, a deterioration in intergenerational equity, confining more to renting which will exacerbate wealth inequality (renters tend to be less wealthy over their lifetime than homeowners) and it is likely contributing to rising homelessness.
Some might see a house price crash as the solution. Yes, this would improve affordability – but it would likely also come with a deep recession and high unemployment which will make it hard for many to buy a house.
Other policies that won’t work, include: grants & concessions for first home buyers (as they just add to higher prices); abolishing negative gearing (which would just inject another distortion into the tax system and would adversely affect supply), although there is a case to cap excessive use of negative gearing tax benefits; banning foreign purchases altogether (as they are a small part of total demand and may make it even harder to get new unit construction off the ground); and a large scale return to public housing (as a major constraint to more units is excessive costs and delays, and just switching to public housing won’t fix this).
There are no quick fixes, but here are the four key things that need to be done to fix affordability:
- First, match the level of immigration to the ability of the property market to supply housing and reduce the accumulated housing shortfall of around 200,000-300,000 dwellings. – we have clearly failed to do this since the mid-2000s and particularly following the reopening from the pandemic, and this is evident in the ongoing supply shortfalls. Our rough estimate is that immigration needs to be cut back to around 200,000 a year (see here where we looked at the issue in detail) from 316,000 over the year to the March quarter.
- Second, build more homes – the commitment by Australian governments to build 1.2 million homes over five years was a welcome move down the path to boost supply. One year into it though and we have only completed 174,000 homes and approvals are only running around 190,000 homes annually, so we are well below the implied 240,000 annual target. To meet the target will require relaxing land use rules, less red and green tape, shifting to faster ways to build including with modular and pre-fab homes, encouraging build to rent affordable housing, training and importing far more tradies and refocussing more on units. In terms of the latter the only time we consistently built more than 200,000 homes per annum was in the unit building boom of the 2015-19 period.
- Third, decentralisation to regional Australia – this needs appropriate infrastructure and measures to boost regional housing supply.
- Fourth, some tax reform – including replacing stamp duty with land tax (to make it easier for empty nesters to downsize) and reducing the capital gains tax discount (to remove a pro-speculation distortion).
But don’t throw the baby out with the bathwater
But in seeking to address the problem we need to act in a balanced way. In particular, immigration has been a huge benefit to Australia by boosting labour supply and addressing labour shortages, supporting state and federal budgets, slowing the aging of the population, boosting innovation and enhancing cultural diversity and vibrancy. In particular, via international students who count as immigrants, it helps drive more than $50bn in education export earnings each year, which is our fourth biggest export earner behind iron ore, coal and gas. Ideally, universities should be able to have as many foreign students as they like providing they house them on campus as this would take pressure off existing housing.
Secondly, observing that Australian cities are very low density compared to cities in Europe, Asia and parts of the US (see the next chart) has led some to suggest that the solution to poor affordability lies in densifying our cities. For example, a plan from the Grattan Institute proposed allowing three story units to be built anywhere in Australia’s capital cities. This extreme form of YIMBYism would be a monumental mistake – not only would it push city land values further into the stratosphere exacerbating inequality but it will put the nail in the coffin of the quarter acre block at the centre of the “Aussie dream” epitomised in films like “They’re a Weird Mob” and “The Castle” and the TV show “Neighbours”, which is one of the things that has made Australia great and why people want to come here. Going down the path of even bigger, congested cities seen internationally is not a solution. Which is why allowing more units in Australian cities should be seen as a short-term measure with decentralisation to regional centres being the long-term solution.
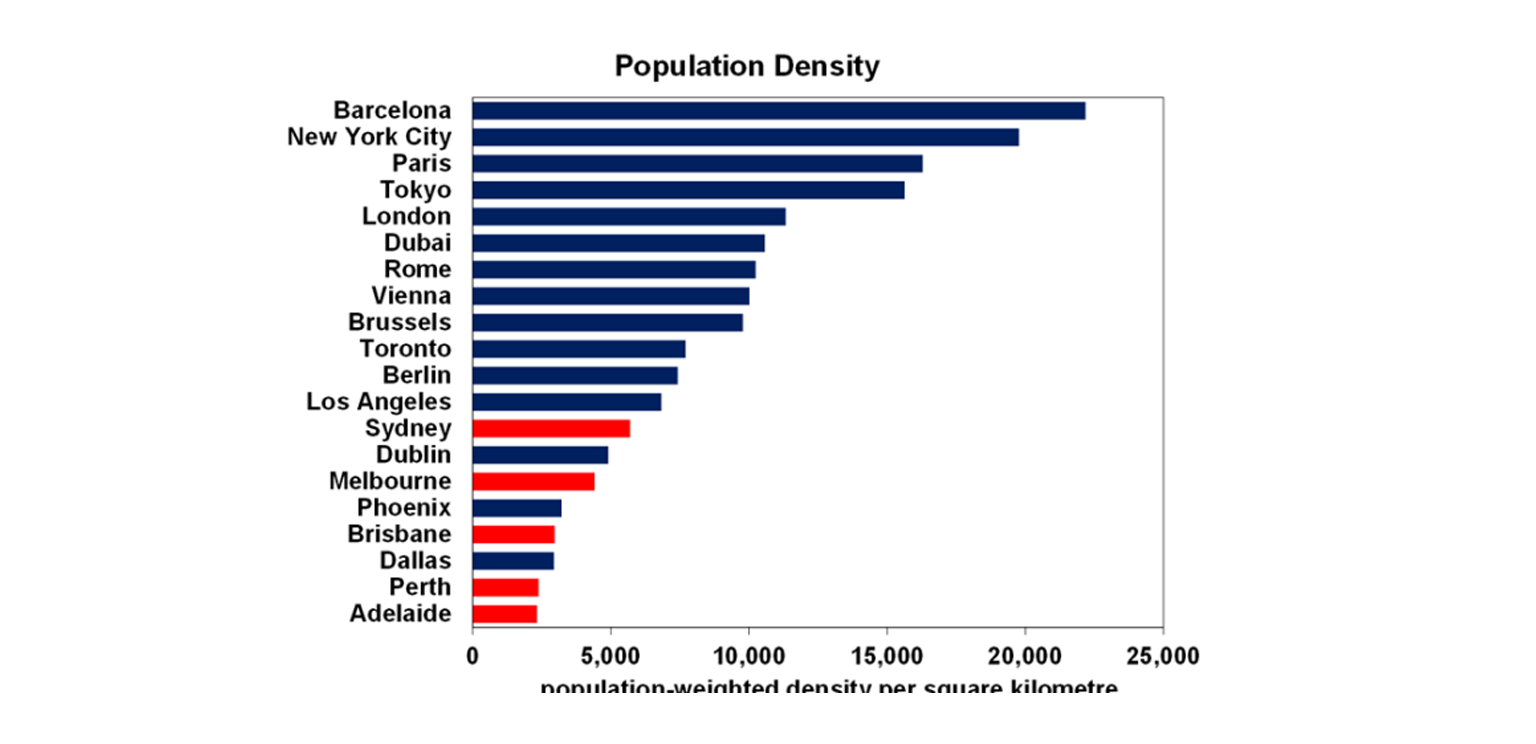
Source: Grattan Institute