Gulf War 3 – the threat to economies and markets from the US/Iran war
By Dr Shane Oliver – Head of Investment Strategy and Economics and Chief Economist, AMP Capital | 2 Mar 2026
Key points
- The start of a war between the US and Israel and Iran poses the risk of a significant disruption to global economic growth given the likelihood of significant disruption to the supply of oil, particularly through the Strait of Hormuz.
- This in turn could contribute to a correction in share prices.
- A $US40 a barrel spike in oil prices could add 40 cents a litre to petrol prices with a threat to growth & inflation. As a “tax on spending” the RBA should look through it.
- For investors: share market falls are normal, timing markets is hard and the key is to stick to a long-term strategy.
Introduction
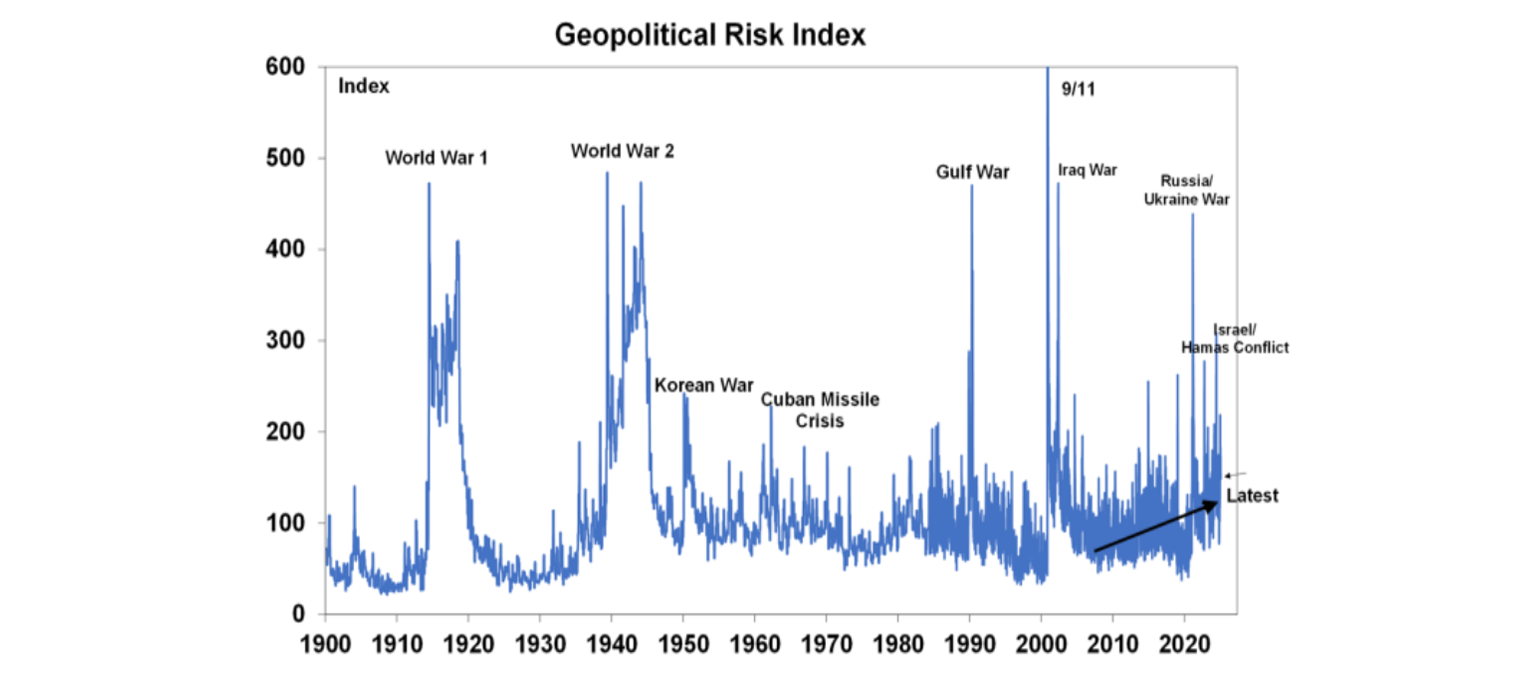
Geopolitical shocks have been a rising feature this year with US “interventions” in various countries – Nigeria, Venezuela, Greenland and now Iran. It now looks like Venezuela was a planned precursor to Iran with the US and Israel launching broad based attacks on Iran on the weekend following its failure to give up its nuclear program. To be sure conflict regularly flares up in the Middle East leading to concerns of a blow to the global economy via a surge in oil prices like in the 1970s and early 1980s, but most of time oil supply is not affected as key producers are not involved. The risks escalated last year with Israel and the US getting involved in conflict with Iran (which supplies around 4.5% of global oil and gas production and exports 1.5 percentage points of that). But last year’s fears settled down after US strikes in June failed to lead to an escalation and oil supplies were unaffected. This time might be different though resulting in a sharper and longer spike in oil prices. So, what are the implications for the global economy and investment markets.
Oil prices on the rise
But first some context regarding oil prices as that is likely where the main shock will come from. The next chart shows world oil prices since 1970 in nominal terms (blue line) and after adjusting for inflation (red line).
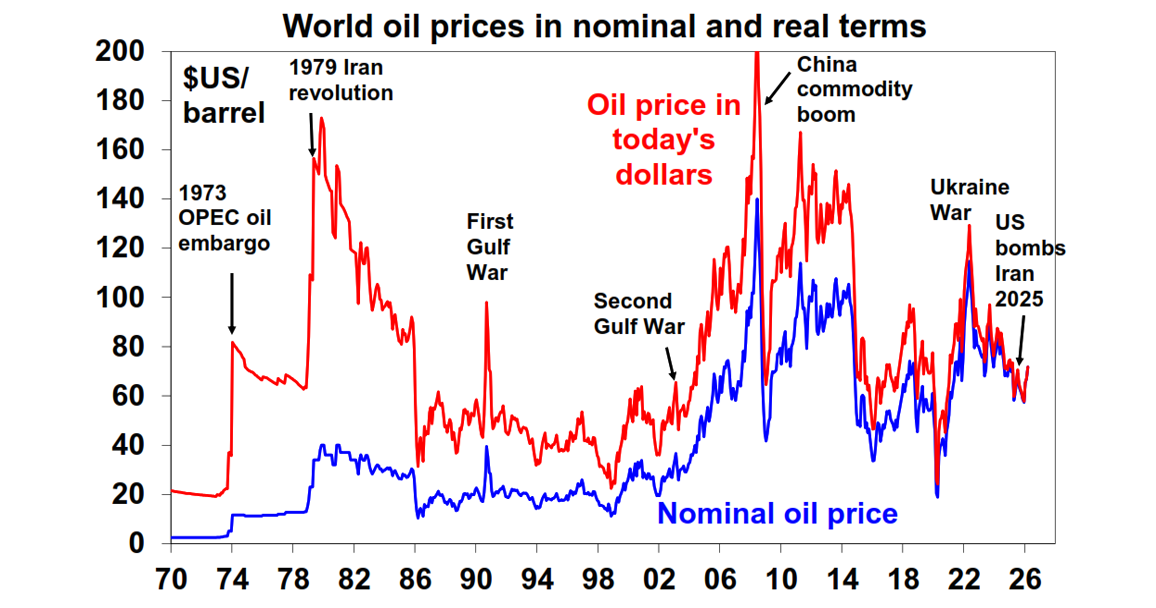
Source: Bloomberg, AMP
From their highs over $US120 a barrel back in 2022 on the invasion of Ukraine oil prices had fallen sharply and were around a low of $US56 in January after the US intervention in Venezuela. Up till Thursday they had risen to around $US67 as the risk of a strike on Iran increased and have spiked to $US72 today after the start of the war with Iran. This leaves them well below the Ukraine War high and in real terms they remain well below the highs seen on the back of the second oil crisis in 1979 and the commodity boom in 2008. But its early days yet.
The risks point to a further spike in oil prices
What we know so far from the conflict that started Saturday is that:
- US & Israeli targets in Iran are broad based (surgical strikes last year).
- President Trump is calling for regime change in Iran urging Iranians to “take over your government”. The shift from surgical strikes in June last year to broad based strikes and regime change implies a potential longer involvement and hence disruption to oil production.
- The Iranian government sensing a threat to its survival is retaliating with a broad range of targets in neighbouring oil producing countries and effectively shutting the Strait of Hormuz through which 20% of global oil production and 25% of LNG flows daily.
- While OPEC countries have about 3.5 million barrels per day of spare capacity able to offset a disruption to Iranian exports of 1.5 million barrels per day, this is academic if the Strait of Hormuz is blocked.
- At the same time Iranian backed Houthis are moving to disrupt shipping again through the Red Sea which will add to transport costs.
This poses the risk of a more significant spike in oil prices, possibly to above $US100/barrel, as oil supplies are severely disrupted, potentially taking them above the highs seen at the start of the Ukraine War. At this stage it’s not clear what the death of Iran’s Supreme leader Ayatollah Ali Khamenei means – it could accelerate the demise of the regime, or it could further motivate his followers.
Constraints on the US
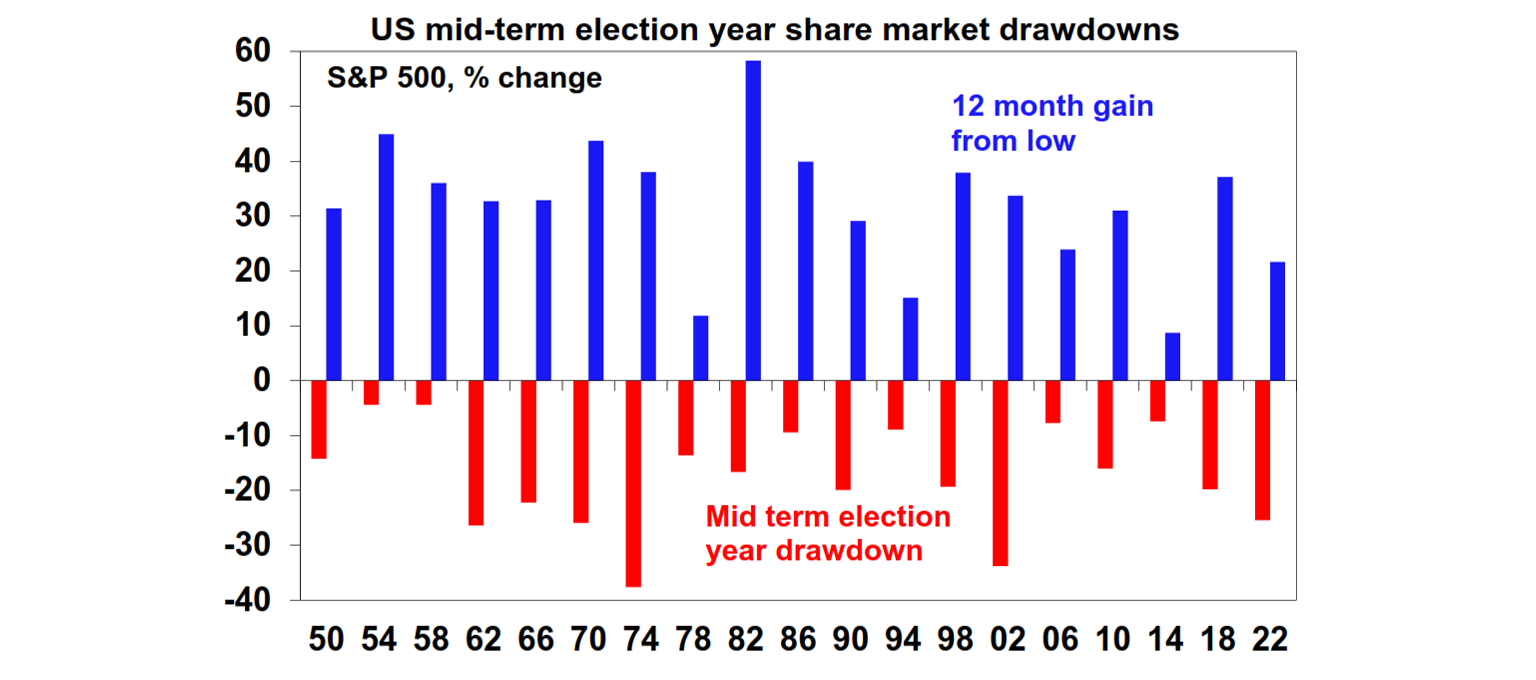
However, the constraints on the US cannot be ignored. Trump is likely to want to minimise the impact on oil prices given the US midterm elections this year and his desire to retain control of Congress. And in particular, most of his MAGA base was motivated by a desire to avoid more “forever wars” so a lengthy entanglement would weaken support from his base.
There are essentially two scenarios
Base case – limited war (60% probability) – given these considerations our base case is that the war is limited with Trump likely finding a way to declare victory in the next week or so, presumably on the basis that he has (again) obliterated the threat from Iran and that he will leave it to the Iranian people to sort out. It may take a few days/weeks before this is clearly apparent so oil prices could still go higher (threatening shares) before they go lower (shares higher) but this would be a selling opportunity in oil and a buying opportunity in shares.
High risk case – oil supplies significantly disrupted (40% probability) – however, Trump may lose the gamble with Iran fighting on for longer forcing the US to say involved longer. Iran could descend into chaos as occurred in Iraq and Afghanistan necessitating US troops on the ground. There are few examples of successful regime change from US interventions in recent decades. This could mean a bigger and much longer disruption to oil supplies, conceivably resulting in a doubling in oil prices to around $US150/barrel, which could drive a sharp fall in shares.
Impact of higher oil prices
Higher oil prices will add to inflation resulting in higher than otherwise interest rates. But it’s not that simple. Central banks will focus on underlying inflation and higher oil prices threaten economic growth. Past oil price surges have played a role in US & global downturns – in the mid-1970s, the early 1980s, the early 1990s, early 2000s and even the GFC. See the next chart. They weren’t necessarily the driver of these recessions, but a rise in energy prices is a tax on consumer spending.
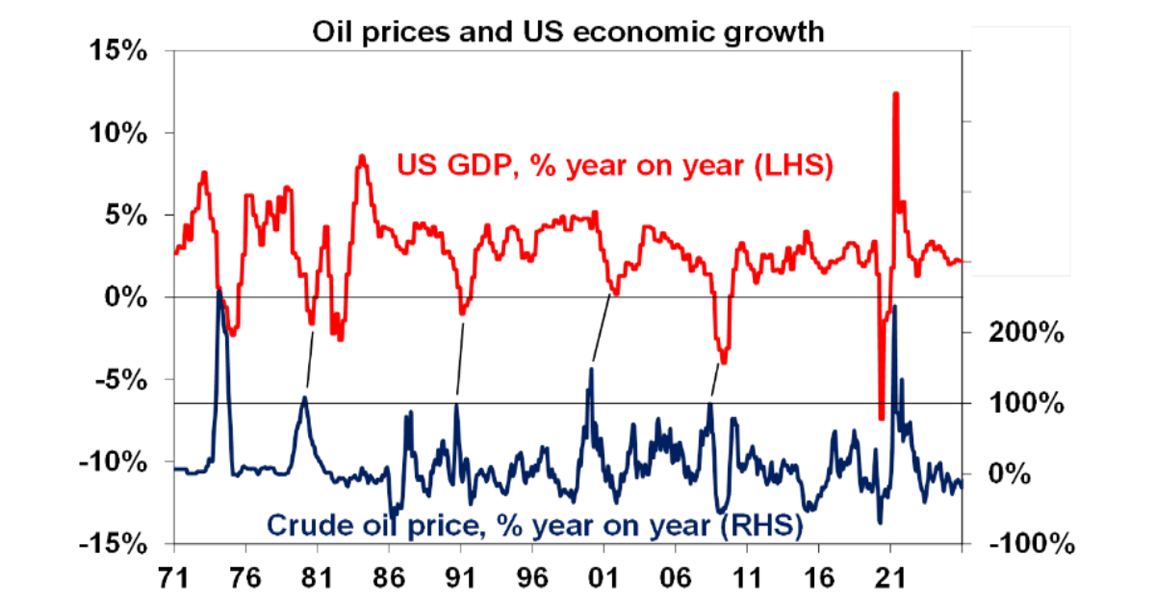
Note: the relationship between oil prices & GDP looks messy over 2020/2021 as oil prices crashed with the pandemic & then rebounded into 2021 but were still low. Source: Bloomberg, AMP
Trouble often ensues if the oil price doubles over 12 months. However, while it will ultimately depend on how high oil prices go there are some positives suggesting it may not be quite as negative as feared:
- First, the oil intensity of economic activity has been falling with energy efficiencies and the growth of the services sector. So, the impact of an oil price surge today is less than it used to be.
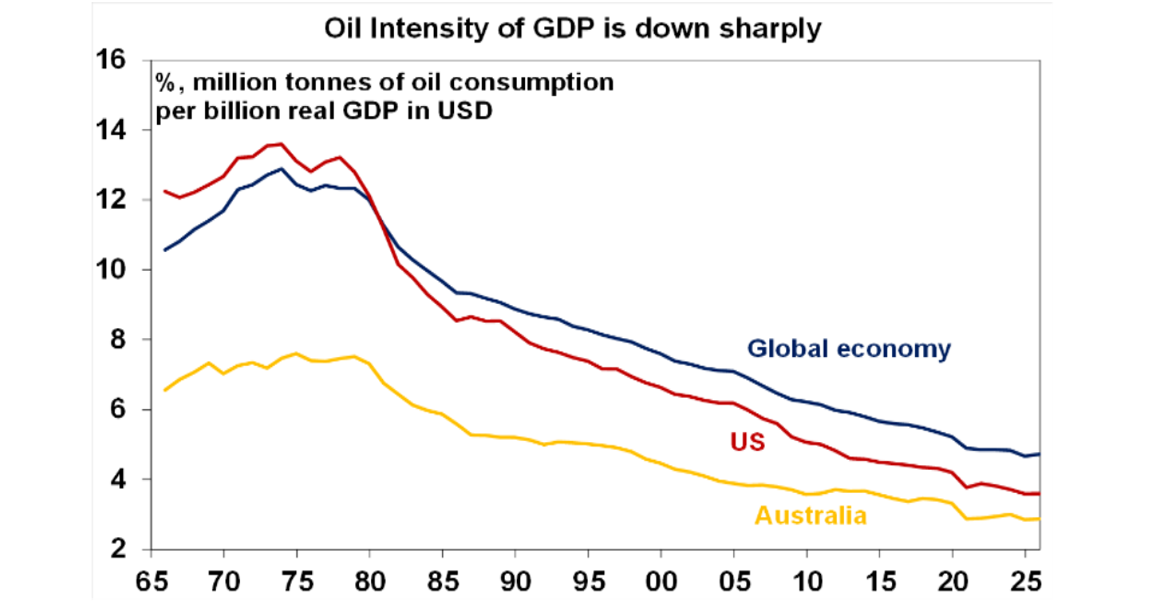
Source: Energy Institute, Bloomberg, AMP
- Secondly, we have not yet seen a doubling over 12 months in oil prices suggesting they are not yet up enough for a big hit to global growth.
Impact on Australia
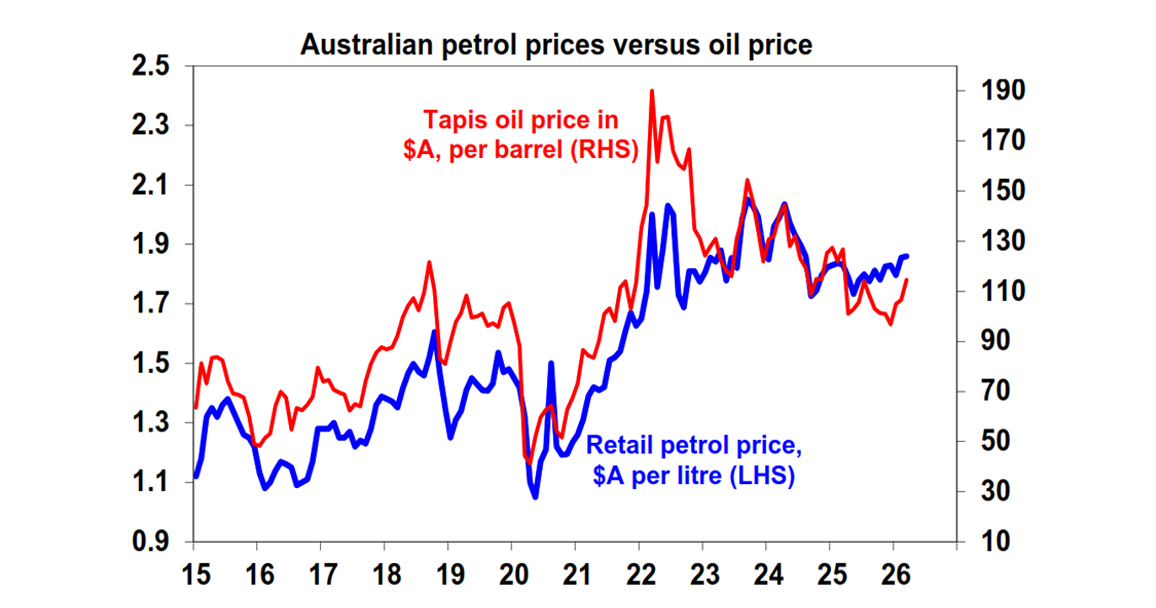
The main way Australians will feel the impact of the war is via higher petrol prices. Australian petrol prices track the Asian Tapis oil price closely & Tapis tracks US oil prices. This is because our prices are set globally – to which is then added tax, transport costs & margins. Roughly speaking each $US1 a barrel rise in oil prices adds around a cent a litre to petrol prices. So, a $US40 a barrel rise in world oil prices taking them above $US100 a barrel would add around 40 cents a litre with a 7-10 day lag if sustained.
Source: Bloomberg, AMP
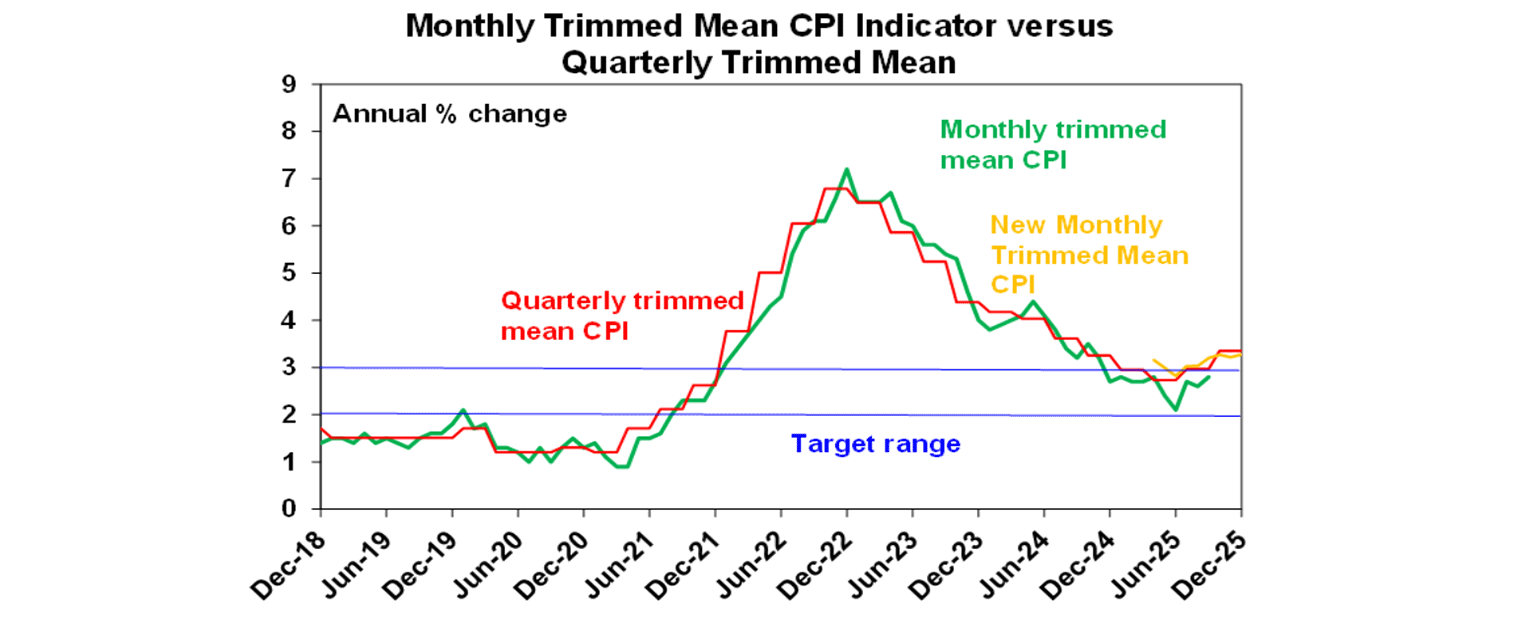
A 40 cents a litre rise in petrol prices would add about 0.8% to CPI inflation, but it would also impart a dampening impact on growth. This is because it would add around $14 a week to the household petrol bill leading to a cut back in spending elsewhere in the economy. In other words, it will act as a tax on households.
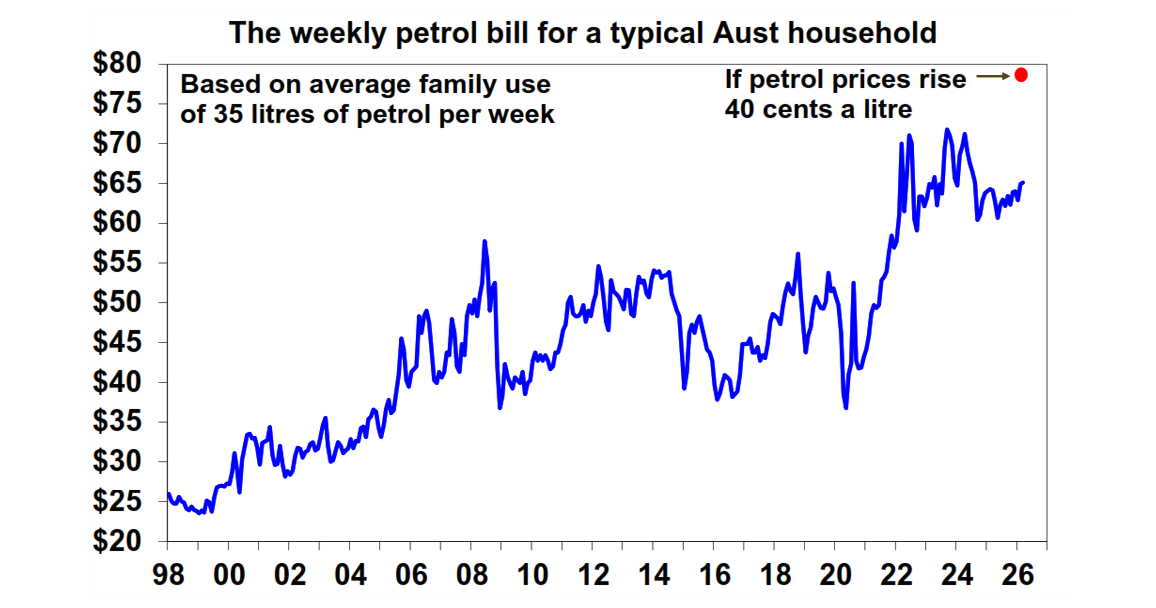
Source: Bloomberg, AMP
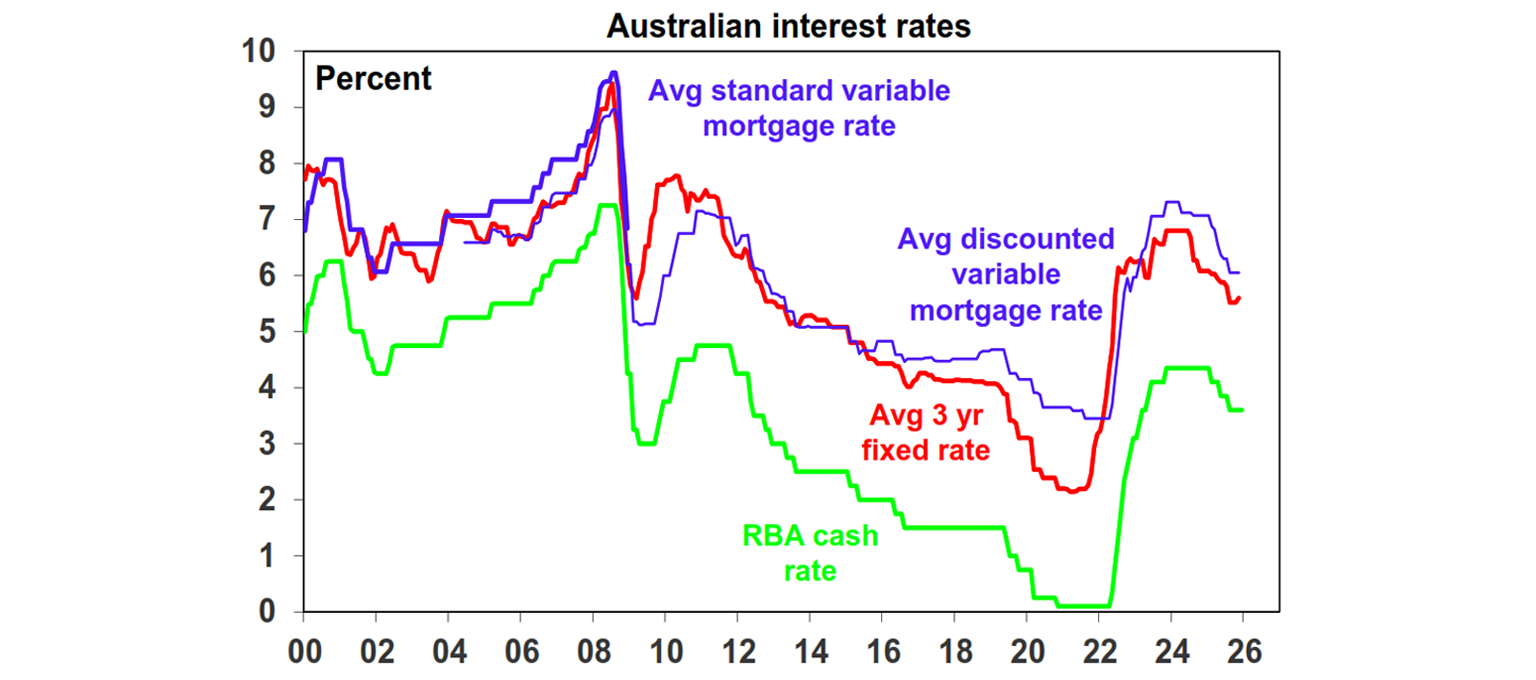
So, for the RBA the implications are ambiguous – a boost to inflation but a hit to growth. We are not changing our view which sees rates on hold with a high risk of another hike. While higher oil prices flowing from the war could drag on Australian growth via weaker global growth, Australia is relatively well placed as we are a net energy exporter & may benefit from higher prices for gas and coal. And our economy is less dependent on oil.
Implications for investment markets
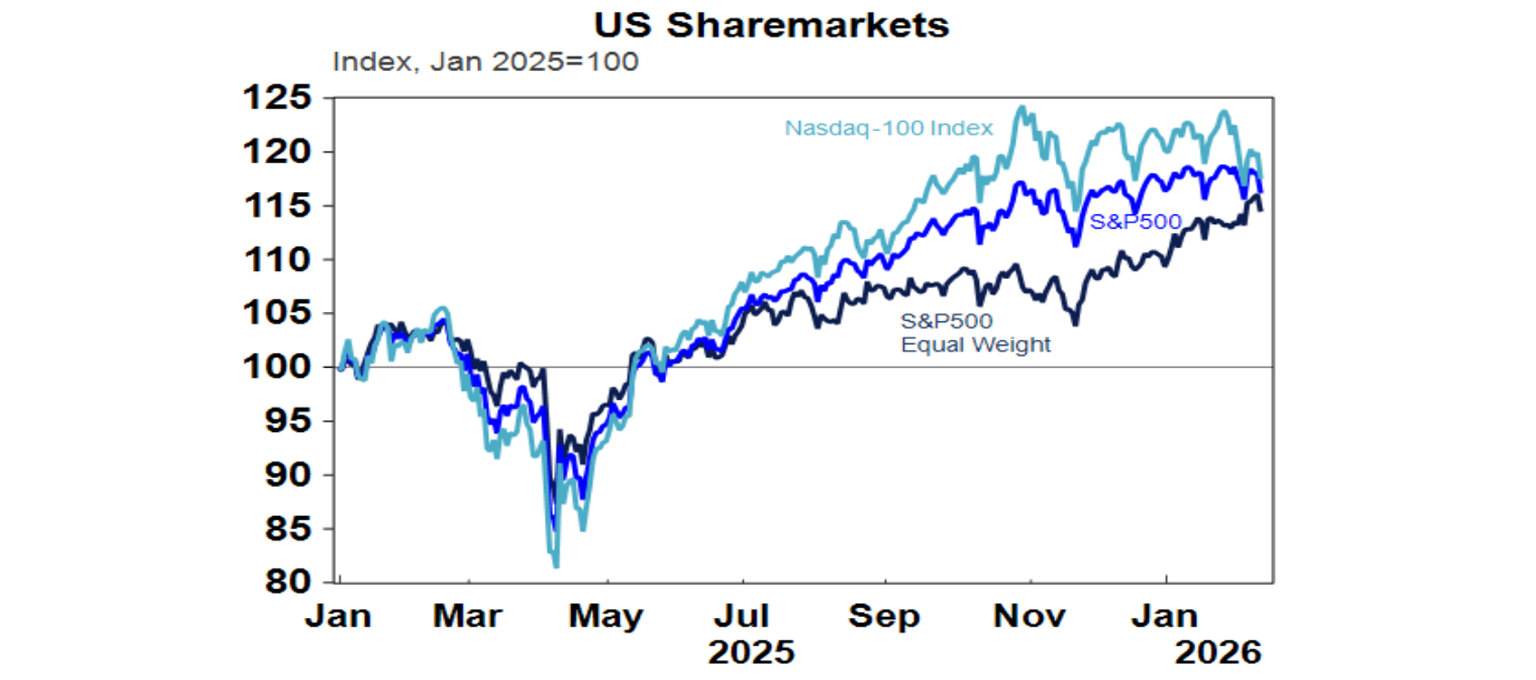
Overall, we see the outbreak of war with Iran as negative for shares (with the risk to growth at a time when the key direction setting US share market was looking a bit vulnerable), but positive for oil and energy prices, gold (as a safe haven) and government bonds (as a safe haven).
Key things for investors to bear in mind
In times of uncertainty like these with a threat to share markets, it’s important to focus on basic investment principles. In particular:
- Share market pullbacks are healthy and normal – their volatility is the price we pay for the higher returns they provide over the long term.
- It’s very hard to time market moves so the key is to stick to an appropriate long-term investment strategy.
- Selling shares after a fall just locks in a loss.
- Share falls provide opportunities for investors to buy them cheaply.
- Shares invariably bottom with maximum bearishness.
- Australian shares offer an attractive income relative to bank deposits.
- To avoid getting thrown off a long-term strategy – it’s best to turn down the noise around all the negative news flow.